This weeks Makeover Monday's data set was the Top 100 Song's Lyrics. After just returning from Tableau's annual conference and being eager to try their new feature, TabPy, this seemed like the perfect opportunity to test it out. In this blog post, I'm going to offer a step-by-step guide on how I did this. If you haven't used Python before, have no fear - this is definitely achievable for novices - read on!
For some context before I begin, I have limited experience with Python. I recently completed a challenging but great course through edX that I'd highly recommend if you are looking for foundational knowledge - Introduction to Computer Science and Programming Using Python. The syllabus included advanced Python including Classes and thinking about algorithmic complexity. However, to run the analysis I did, it would be helpful to look up and understand at a high level:
If you see this after your install finished, you're all set!
Part 2 - Connecting to TabPy in Tableau

Now you can use this calculated field in views with [Word] to process the sentiment score! The downside is that since this is a table calculation and also uses ATTR, you cannot use this within a level of detail calculation (LOD). So unfortunately, you cannot sum of the sentiment on the level of detail of song using this example and data structure. With some data manipulation it is possible but I won't be diving into that.
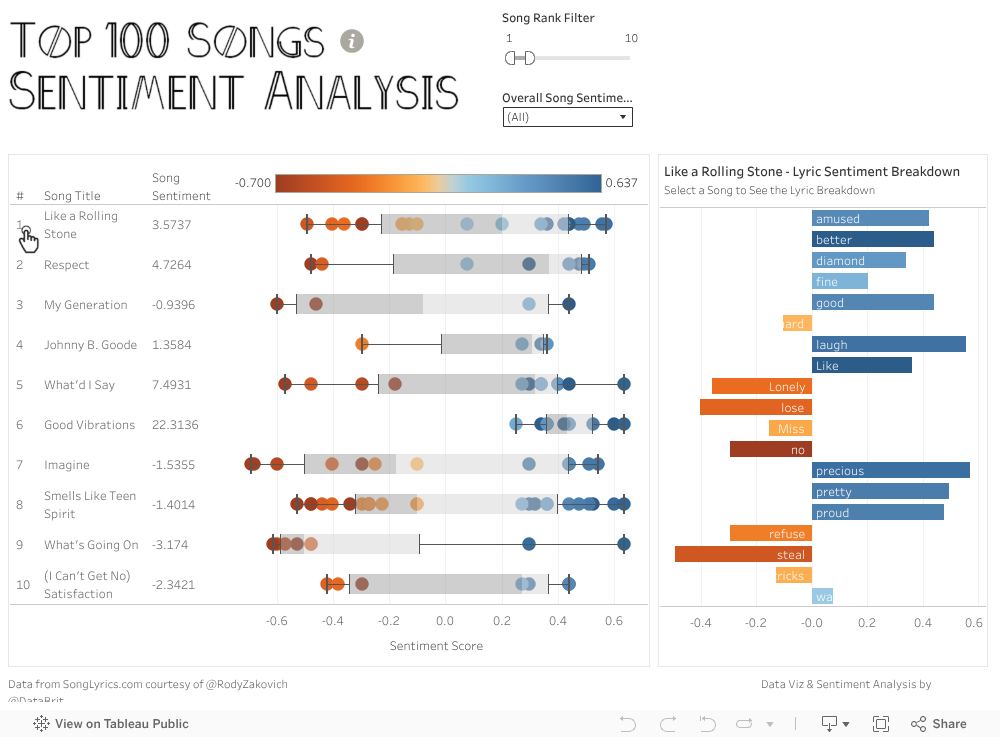
Here's the final viz - half of it is cut off so be sure to view it in Tableau Public:
For some context before I begin, I have limited experience with Python. I recently completed a challenging but great course through edX that I'd highly recommend if you are looking for foundational knowledge - Introduction to Computer Science and Programming Using Python. The syllabus included advanced Python including Classes and thinking about algorithmic complexity. However, to run the analysis I did, it would be helpful to look up and understand at a high level:
- basic for loops
- lists
- dictionaries
- importing libraries
The libraries I used for this, should you want to look up additional documentation, are:
- pandas
- nltk
- time (this one isn't really necessary - I just used it to test computation time differences between TabPy and local processing.)
Part 1 - Setting Up Your Environment
Read through the install directions. Here's my simplified version for those not comfortable with GitHub or command line:
- Click the green "Clone or Download" button.
- Select Download
- Unzip the file and save locally (I moved mine to my desktop)
- Open your Terminal and navigate to your TabPy folder. Run these commands:
If you see this after your install finished, you're all set!
Now it's time to setup your TabPy in Tableau. In Tableau 10.1 go to:
Help > Settings and Performance > Manage External Connection
and enter localhost since you're running TabPy on your own computer. The default port is 9004 so unless you manually changed you should leave it at that
Part 3 - Creating your TabPy Calculation
The TabPy Github page has extensive documentation you should review on using python in Tableau calculations. I simply repurposed one of the calcs they demoed during the TabPy session at #data16 - catch the replay here.
Using the Top 100 songs data set, create this calculated field.
Everything following # is a comment just to help make sense of what the code is doing. Feel free to remove that text.
Now you can use this calculated field in views with [Word] to process the sentiment score! The downside is that since this is a table calculation and also uses ATTR, you cannot use this within a level of detail calculation (LOD). So unfortunately, you cannot sum of the sentiment on the level of detail of song using this example and data structure. With some data manipulation it is possible but I won't be diving into that.
TabPy vs. Pre-Processing Data for Tableau
Unfortunately, you cannot publish vizzes using TabPy to Tableau Public. If you want to download the .twbx version I made using TabPy, you can do so here.
However, you could run this analysis outside of Tableau and simply import the output and create your viz that way. I did this which also gave me more flexibility with LODs since I no longer was using TabPy.
TabPy definitely took me less time and required less code. However, it did take
~2.5 minutes*** to process 8,668 words whereas when I ran my code (below) outside of Tableau it took under 1 second to get the scores and write them back to a CSV.
***11/17 Update: Bora Beran made a great point; be mindful of how you're addressing your TabPy Table Calc - "If you have all your dimensions in addressing we will make a single call to Python and pass all the data at once which will be much faster. Otherwise we make one call per partition. If e.g. song title is on partitioning we would send a separate request for each song. If word is on partitioning we will send a separate request per word."
At the time of posting this blog, I was addressing all dimensions in view and on a few occasions when working with this data I experienced a very slow result return time as stated. However, today when running this calc it took the same time in Tableau as I stated outside of Tableau. I don't have a clear idea as to why but I was running that query on my local machine and think it might have simply been to limited resources to process the analysis at the time.
This is what the code would like like outside of TabPy. You can run this code in a Jupyter notebook or another IDE - I used Spyder only because I used that for my class.
You can download my Tableau Public viz which uses the output of the below code to inspect further!
Here's the final viz - half of it is cut off so be sure to view it in Tableau Public:
Hi Brit,
ReplyDeleteI think for this type of analysis, as you also said, it is a good idea to preprocess since it looks like data is not dynamic. But I was wondering.. What were you using for your addressing table calc setting on the Python calculated field?
If you have all your dimensions in addressing we will make a single call to Python and pass all the data at once which will be much faster. Otherwise we make one call per partition. If e.g. song title is on partitioning we would send a separate request for each song. If word is on partitioning we will send a separate request per word.
In the GIF it looked like we're sending a large number of requests. Do you mind trying with everything on addressing? This should log only one entry in your console and I would expect it to be noticeably faster.
For the TC demo if I recall correctly we were running sentiment analysis on the fly on 18K tweets and it was less than 1.5 seconds.
Thanks,
Bora
Hi Bora,
DeleteThanks for the comment - great point! I just double checked and when I clocked the 2.5 minutes it was addressing all the dimensions. However, the extremely odd thing is that it's now working within Tableau at the same speed it did outside of Tableau. This is different from the behavior I observed earlier this week and I'm not sure I understand why...perhaps it was just chance that I had other applications using a lot of my machines resources that it was slow to process that query? I'm not sure - I'll update this post though to not deter others!
Brit
Hi Bora,
DeleteCould you please elaborate a bit more on this? What does that mean "add everything on addressing"?
Does that mean to add all the dimensions that are relevant for scoring to the second part of SCRIPT_REAL. i.e SCRIPT_REAL("",ADDRESSING?)
SCRIPT_ calculations are table calculations. If you click on the pill, you should see an option to edit table calculation. In the Table Calculation dialog you will see a list of all the dimensions in your current sheet. If you check all the boxes next to the names of dimensions you will be adding everything to addressing. TabPy GitHub page has an example of this (the second Tableau screenshot on the page).
Deletehttps://github.com/tableau/TabPy/blob/master/TableauConfiguration.md
In this example, you will see that CustomerID is the only item checked hence being used as addressing. Category and Segment are not checked which means they are being used for partitioning. Because of this Tableau will make a separate request to Python for every Category-Segment combination such that you get the correlation coefficient for each pane e.g. Technology-Consumer, Technology-Corporate, Office Supplies-Corporate and so on.
I hope this helps.
Bora
Hi Brit,
ReplyDeleteVery interesting blog. I am new to python. Could you please explain the below lines of code
1) word_score_dict[words[i]] = scores[i]
2) Why are you using list and .iteritems while creating the below dataframe. Can't we just pass the word_score_dict as is
df = pd.DataFrame(list(word_score_dict.iteritems()), columns=['word','score'])
Floyd
DeleteHi Floyd - thanks for the questions! This was my first time using pandas so I did have to do some Googling to figure out how to create the data frame and am welcoming any feedback to improve! With that said, here’s my responses:
1. At this point in the code I have a two lists - one that contains my words and one that contains the scores. Since Python lists are ordered, I know that the first word in my Word list’s score can be found by accessing the first score in my Score list and on and on. So that line of code is essentially iterating through those two lists and creating a Python dictionary of key:value pairs. I’m going to put a link at the bottom of this comment where you can see this visually! But - to be honest what I did wasn’t that elegant. It works but a better, more concise way would be to instead make a dictionary from the get go vs. two list that I then create the dictionary with. That code would instead be: text = top_100['Word'] sid = SentimentIntensityAnalyzer() word_score_dict = {} for word in text: ss = sid.polarity_scores(word) word_score_dict[word]=(ss['compound'])
2. the issue I had with passing word_score_dict was it caused a ValueError: If using all scalar values, you must pass an index. When I did some searching I came across this:
http://stackoverflow.com/questions/17839973/construct-pandas-dataframe-from-values-in-variables
http://pythontutor.com/visualize.html#code=words%20%3D%20%5B%22happy%22,%20%22sad%22%5D%0Ascores%20%3D%20%5B0.57,-0.48%5D%0Aword_score_dict%20%3D%20%7B%7D%0A%0Afor%20i%20in%20range(len(words%29%29%3A%0A%20%20%20%20word_score_dict%5Bwords%5Bi%5D%5D%20%3D%20scores%5Bi%5D%0A%20%20%20%20%0Aprint(word_score_dict%29&cumulative=false&heapPrimitives=false&mode=edit&origin=opt-frontend.js&py=2&rawInputLstJSON=%5B%5D&textReferences=false
This comment has been removed by the author.
ReplyDeleteThanks for you post on tableau and python.Expecting some more articles from you blog.
ReplyDeleteTableau Training in Hyderabad
Hi Brit, which one is your calculated field? I couldn't find it in your workbook. Where did you store the following?
ReplyDelete#SCRIPT_REAL is a function in Tableau which returns a result from an external service script. It's in this function we pass the python code.
SCRIPT_REAL("from nltk.sentiment import SentimentIntensityAnalyzer
text = _arg1 #you have to use _arg1 to reference the data column you're analyzing, in this case [Word]. It gets word further down after the ,
scores = [] #this is a python list where the scores will get stored
sid = SentimentIntensityAnalyzer() #this is a class from the nltk (Natural Language Toolkit) library. We'll pass our words through this to return the score
for word in text: # this loops through each row in the column you pass via _arg1; in this case [Word]
ss = sid.polarity_scores(word) #passes the word through the sentiment analyzer to get the score
scores.append(ss['compound']) #appends the score to the list of scores
return scores #returns the scores
"
,ATTR([Word]))
Very nice
ReplyDeleteThanks for sharing the information about the Tableauand keep updating us.This information is really useful
ReplyDeleteThe blog gave me idea to use python for sentiment analysis My sincere thanks for sharing this post Thanking you
ReplyDeletePython Training in Chennai
Thank you so much for sharing this worth able content with us. The concept taken here will be useful for my future programs and i will surely implement them in my study. Keep blogging article like this.
ReplyDeletePython Training In Bangalore
Thanks for splitting your comprehension with us. It’s really useful to me & I hope it helps the people who in need of this vital information.
ReplyDeleteSoftware Testing Training in chennai
Crisp.. I have decided to follow your blog so that I can myself updated.
ReplyDeleteSoftware Testing Training in chennai
This is an awesome post.Really very informative and creative contents. These concept is a good way to enhance the knowledge.I like it and help me to development very well.Thank you for this brief explanation and very nice information.Well, got a good knowledge.
ReplyDeletePython Training in Chennai
Thanks for sharing this useful information. I read your blog completely.It is crispy to study. I gather lot of information about python with the help of this blog.
ReplyDeleteThanks for sharing..want more informaion about python.
Python Online Training
Hi all dear!
ReplyDeleteI like your pages and i would like to share this post with your collection.
Thank you!!!
จีคลับ
goldenslot mobile
hello everyone.....
ReplyDeletethank the good topic.
Welcome To Casino online Please Click the website
thank you.
ทางเข้าจีคลับ
gclub casino
goldenslot slots casino
Hi Brit,
ReplyDeleteI think for this type of analysis, as you also said, it is a good idea to preprocess since it looks like data is not dynamic. But I was wondering..Thanks for sharing..,
Python Online Training
Hi admin..,
ReplyDeleteVery nice blog.I understand the concept you put it in the blog. you are put it very crizpy information. Thanks for sharing..
Python Online Training
Very nice
ReplyDeleteThank you for sharing this content
ReplyDeletepython online training
Really cool post, highly informative and professionally written and I am glad to be a visitor of this perfect blog, thank you for this rare info!
ReplyDeleteTableau Online Training
Very nice blog.I understand the concept you put it in the blog. you are put it very crizpy information. Thanks for sharing..
ReplyDeletegoldenslot casino
บาคาร่าออนไลน์
gclub casino
Thank you for sharing this its very nice python online training
ReplyDeleteGreat Article… I love to read your articles because your writing style is too good, its is very very helpful for all of us and I never get bored while reading your article because, they are becomes a more and more interesting from the starting lines until the end.
ReplyDeleteTableau online training
Very useful & Informative
ReplyDeleteBest Android Training in Chennai, Velachery
Best ios Training in Chennai, Velachery
Best PHP Training in Chennai, Velachery
Best Dot Net Training in Chennai, Velachery
Really it was an awesome article. Very useful & Informative
ReplyDeleteFreshers Jobs in Chennai
The great service in this blog and the nice technology is visible in this blog. I am really very happy for the nice approach is visible in this blog and thank you very much for using the nice technology in this blog
ReplyDeleteData Science Online Training
Hadoop Online Training
This is an awesome post.Really very informative and creative contents. These concept is a good way to enhance the knowledge.I like it and help me to development very well.Thank you for this brief explanation and very nice information.Well, got a good knowledge.
ReplyDeleteTableau Online Training|
SAS Online Training |
R Programming Online Training|
Superb. I really enjoyed very much with this article here. Really it is an amazing article I had ever read. I hope it will help a lot for all. Thank you so much for this amazing posts and please keep update like this excellent article.thank you for sharing such a great blog with us.
ReplyDeletePython Training in Chennai | Best Python Training in Chennai | Big Data Analytics Training in Chennai
Thanks for sharing great information datascience online training in hyderabad
ReplyDeleteI really like you post,Thanks for your sharing.
ReplyDeleteดูหนังออนไลน์
This comment has been removed by the author.
ReplyDeleteThanks for the information. The information you provided is very helpful for Tableau Learners. https://mindmajix.com/tableau-advanced-training
ReplyDelete"Nice info!”Thanks for sharing great information.
ReplyDeleteTableau online training |Tableau online course
Hello,
ReplyDeleteThe Article on Using Python for Sentiment Analysis in Tableau is nice .It give detail information about Phython for Sentiment Analysis. data science consulting
Thanks for sharing nice information DATASCIENCE ONLINE TRAINING IN HYDERABAD
ReplyDeleteBesant Technologies is a leading Python Training . we offer this course through online we have great experience in succeeding students through online courses. we can calculate our performance through their honest comments in our sites in supporting our services. we have referral program so candidates can earn money through referral. you can share your live experience with other can generate you some money.
ReplyDeleteSelenium Training in Bangalore |
Python Training in Bangalore |
Your blog is very useful for me.I really like you post.Thanks for sharing.
ReplyDeleteดูหนังผี
Very nice blog helpful to everyone Python training in bangalore
ReplyDeleteArticle is quite good. Pegasi Media is a b2b marketing firm that has worked with many top organizations. Availing its email list is fast, simple, convenient and efficient. Appending services adds the new record as well as fills up the fields that are missing. Pegasi Media Group also perform Data Refinement, Data building, Data Enchancement, and Data De-Duplication. Database marketing is a form of direct market in which the customers are contacted through their email addresses with the help of the database. There is a scope for email marketing to generate personalized communication with the clients in order to promote your sales.
ReplyDeleteBig Data Users
REALLY GOOD! i like it so much<3 Thanks for the Good Artickle.
ReplyDeletesanadomino
very good blog helpful to everyone python training in bangalore
ReplyDeleteThank you for sharing valuable information. Nice post. I enjoyed reading this post.
ReplyDeleteหนังจีน
I really enjoyed reading the Post. It was very informative and useful for me.
ReplyDeleteBest Software Training Institute in bangalore
Best SAP Training in bangalore
Best Advanced Excel Training in bangalore
very good !!! poker online betting
ReplyDeleteVery nice blog python interview questions
ReplyDeleteAWS interview questions
manual testing interview questions
software testing interview questions
Excellent article on the importance of R programming in tableau tool. I am working in the tableau related project. I gain some new updated regarding the tableau tool R Programming. Keep updating the recent updates of R. Thank you admin.
ReplyDeleteRegards:
R Programming Training in Chennai |
R Training in Chennai
intext:"I gotta bookmark this website it seems extremely helpful very helpful"
ReplyDeletejudi bola online terbesar
This comment has been removed by the author.
ReplyDeletethe blog is about Using Python for Sentiment Analysis in Tableau #Python it is useful for students and Python Developers for more updates on python
ReplyDeletefollow the link
Python Online Training
For more info on other technologies go with below links
tableau online training hyderabad
ServiceNow Online Training
mulesoft Online Training
java Online Training
dot net Online Training
intext:"I gotta bookmark this website it seems extremely helpful very helpful"
ReplyDeletejudi bola
very nice article python training
ReplyDeleteThis comment has been removed by the author.
ReplyDeleteThis comment has been removed by the author.
ReplyDeletewell done! the blog is good and Interactive and it is about Using Python for Sentiment Analysis in Tableau it is useful for students and tableau Developers for more updates on Tableau follow the link
ReplyDeletetableau online Course
For more info on other technologies go with below links
Python Online Training
ServiceNow Online Training
mulesoft Online Training
nice information thank you for sharing.
ReplyDeleteDigital Marketing
Best and informative info on the Data Science training
ReplyDelete
ReplyDeleteWell Done ! the blog is great and Interactive it is about Python for Data Analysis : Reading and Writing Data it is useful for students and Python Developers for more updates on python follow the link
Python Online Training
For more info on other technologies go with below links
tableau online course Bangalore
ServiceNow Online Training
mulesoft Online Training
intext:"I wan to meet you it seems extremely helpful very helpful"
ReplyDeletebandar judi online
Helpful post, Continue sharing more like this.
ReplyDeleteAdvanced Excel Training | Excel Training in Chennai
Thanks for sharing the information ,keep updating us.This information is really useful to me
ReplyDeleteBest Tableau Training Institute in Hyderabad
ReplyDeleteWell Done ! the blog is great and Interactive it is about Using Python for Sentiment Analysis in Tableau books it is useful for students and Python Developers for more updates on python follow the link
https://onlineitguru.com/python-online-training.html